Stay informed and breathe better with real-time Air Quality Index (AQI) and weather data from around the world. Track air pollution, monitor key pollutants, and view accurate weather updates to make smarter health and travel decisions.
? Key Features:
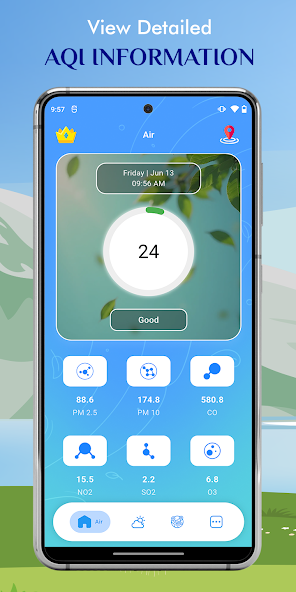
? Live AQI Data
Real-time AQI and pollution levels by city, including key pollutants: PM2.5, PM10, CO, NO₂, O₃, SO₂, and more.
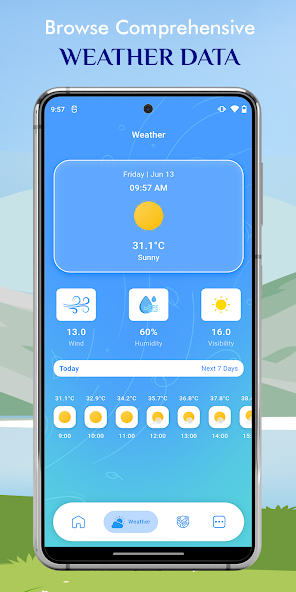
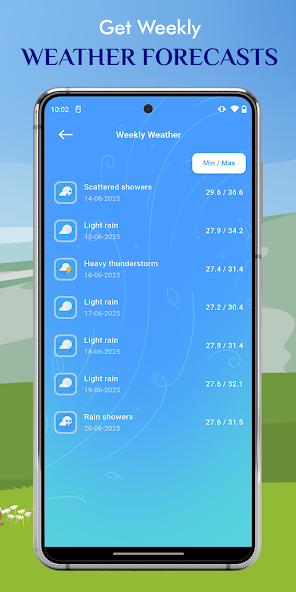
☁️ Weather Information
Get current weather conditions including temperature, humidity, wind, sunrise & sunset, and weekly forecasts.
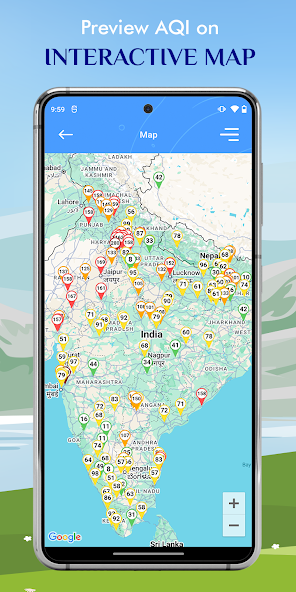
?️ Map View
Explore AQI levels for nearby cities on an interactive map.
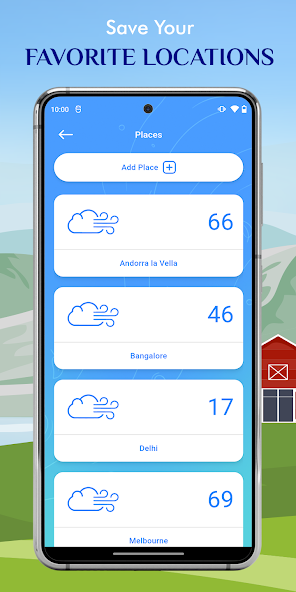
⭐ Favorite Places
Save your frequently checked locations for quick access to air quality and weather data.
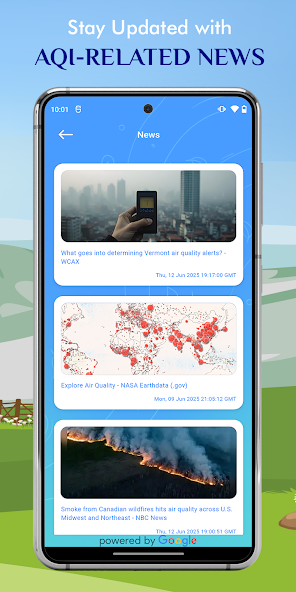
? Air Quality News
Get the latest news and updates on pollution and environmental health.
? AQI Chart
Understand pollution levels with a simple, color-coded chart—from Good to Hazardous—with health guidance.
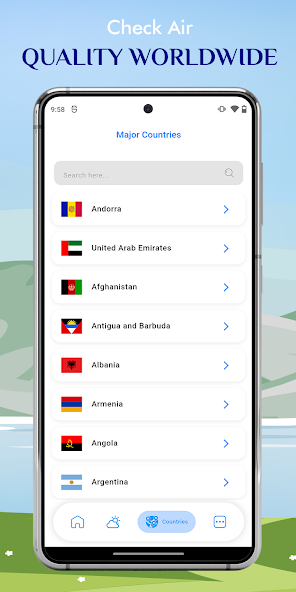
? Country & City Selector
Browse AQI by country and city with flags for easier recognition of your location.
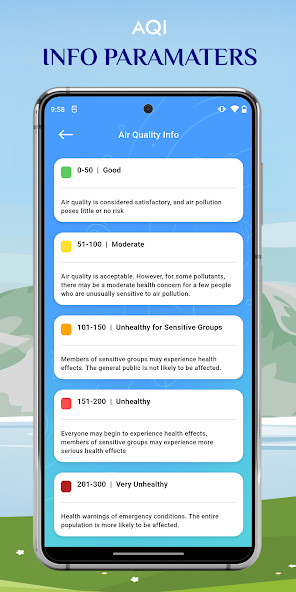
⚠️ AQI Levels Explained:
Green (0–50): Good – Air quality is satisfactory
Yellow (51–100): Moderate – Acceptable, minor risks for sensitive people
Orange (101–150): Unhealthy for sensitive groups
Red (151–200): Unhealthy – Everyone may begin to feel effects
Purple (201–300): Very Unhealthy – Health warnings issued
Brown (301+): Hazardous – Emergency conditions
Stay ahead of pollution and changing weather conditions. Download now to track air quality and weather, wherever you are.
? Key Features:
? Live AQI Data
Real-time AQI and pollution levels by city, including key pollutants: PM2.5, PM10, CO, NO₂, O₃, SO₂, and more.
☁️ Weather Information
Get current weather conditions including temperature, humidity, wind, sunrise & sunset, and weekly forecasts.
?️ Map View
Explore AQI levels for nearby cities on an interactive map.
⭐ Favorite Places
Save your frequently checked locations for quick access to air quality and weather data.
? Air Quality News
Get the latest news and updates on pollution and environmental health.
? AQI Chart
Understand pollution levels with a simple, color-coded chart—from Good to Hazardous—with health guidance.
? Country & City Selector
Browse AQI by country and city with flags for easier recognition of your location.
⚠️ AQI Levels Explained:
Green (0–50): Good – Air quality is satisfactory
Yellow (51–100): Moderate – Acceptable, minor risks for sensitive people
Orange (101–150): Unhealthy for sensitive groups
Red (151–200): Unhealthy – Everyone may begin to feel effects
Purple (201–300): Very Unhealthy – Health warnings issued
Brown (301+): Hazardous – Emergency conditions
Stay ahead of pollution and changing weather conditions. Download now to track air quality and weather, wherever you are.
Updated on
Mar 06, 2026
WEATHER